
Subtidal Habitat Maps are Now Available
for San Francisco Bay
An important first step in developing the subtidal goals was collecting and mapping baseline subtidal habitat geospatial data for the entirety of San Francisco Bay. The Subtidal Goals Project has assembled existing subtidal habitat GIS data and created the first set of comprehensive interactive maps illustrating the locations and extent of the bay’s core subtidal habitats. This is a monumental step for better understanding and protecting these areas, as information about distribution of subtidal habitats has been lacking to date.
Compiling Data Amidst Multiple Data Gaps
Habitat data, from side-scan sonar and multibeam data and sediment samples, were compiled from a 2003 report (Greene et al 2003), as well as anecdotally from experts involved in the Subtidal Goals Project. The 2003 report distinguished 91 different bottom types in the Central and South Bays at the time of data collection although these likely change as strong tidal currents transport sediments around. For the purposes of this project, these 91 habitat types were consolidated, on the basis of their predominant sediment, into 6: soft substrates (including mud, sand, gravel, cobble, and shell mix); rock; artificial structures; shellfish beds; submerged aquatic vegetation beds; and macroalgal beds. This approach, while necessary for the purposes of the project, undoubtedly simplifies habitat types throughout the bay, when in reality most subtidal areas are a vast combination of varying and ever-changing substrates.
In addition, existing data layers of activities (and artificial structures) that can impact the bay’s subtidal habitats were collected and mapped to spatially illustrate the relationship between habitats and stressors. Finally, for some habitat types in the bay, proposed restoration sites are shown, based upon areas that had successful existing pilot projects or were identified as suitable habitat (see Chapters 7 and 8).
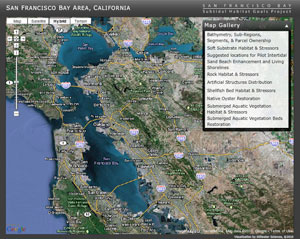
Map Types
Four types of maps were created and included in this report:
1. Habitat distribution maps
2. Stressor maps. There are four main stressor categories, and each has multiple activities that have been mapped:
- Activities that increase or redistribute contaminants: wastewater discharge, coastal industry (power generation, oil refining, and chemical processing), dredging and disposal, sand mining, shell mining, commercial fishing, research and education, natural resource management and restoration, and urban development.
- Activities that increase bottom disturbance: shipping, construction of marinas, ports and wharfs, dredging and disposal, sand mining, shell mining, commercial fishing, research and education, natural resource management and restoration.
- Activities that increase suspended sediments: commercial fishing, dredging and disposal, sand mining, shell mining, research and education, natural resource management and restoration, and urban development.
- Placement of artificial structures: ports and wharfs, pilings, buoys, berthing areas, beacons, duck blinds, and activities associated with coastal industry, bridges, wastewater discharge, commercial shipping and recreational boating, and urban development.
3. Proposed restoration site locations: native oysters, native eelgrass, and suggested pilot locations for intertidal sand beaches and living shorelines.
4. Ownership of the subtidal lands: public and private parcel ownership data.
Future Use of the Maps
Although there are some data gaps that need to be filled and more maps that need to be made (see next section), the maps in this report should allow individuals, agencies, non-profits, governments, and others to see the submerged areas of the bay in an entirely new light. With these maps, interested parties will be able to access a wealth of data and new information for use in their own projects. These maps will
- improve existing resource management
- provide better data for use in research projects
- allow a finer assessment of stressor impacts on particular habitats at given site locations
- highlight appropriate restoration project sites
- facilitate improved cumulative impact assessments
- illustrate and help resolve overlapping human use conflicts
- allow consideration of lands for acquisition and restoration
The information in the maps can also be used in potential future Marine Protected Area or Marine Spatial Planning projects in San Francisco Bay.